


Addinsight's James Cox explores the evolution of Bluetooth in probe data collection using real data from the Addinsight platform.
It was just five years ago that I wrote a blog exploring the probe data collection, comparing the merits of the two main detection methods at the time – Bluetooth or Wi-Fi Scanners.
Fast forward to present day, and the landscape of probe data collection has changed dramatically.
New sources of probe data and scanning technology have significantly improved the quality and usability of travel time data. We’ve seen sample rates improve tenfold, broadening the use cases for utilising the data to make smarter decisions.
In this blog, I’ll provide an overview of these changes along with my personal perspectives and observations based on data collected by Addinsight.
Bluetooth technology has come a long way
A lot has changed in the Bluetooth space in the last five years. Historically, traffic intelligence software or systems referred to as “Bluetooth systems” only typically used one data source – Bluetooth Classic (BT).
Now, Bluetooth data has broadened considerably to include Bluetooth Low Energy (BT LE) and Undiscoverable Bluetooth (BT LAP), resulting in about five to 10 times more travel time samples.
This new depth of data is captured by more advanced sensors and utilised by software such as Addinsight, enhancing real-time visibility into changes in traffic conditions, even on low-volume roads.
Below is a sample of five-minute unique probe count data collected by a single multi-scanner device.
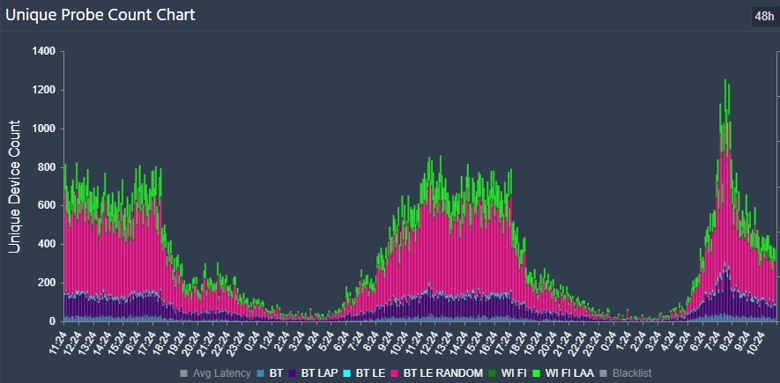
Device Unique Probe Count Chart per five-minute interval across a 48-hour window.
BT=Bluetooth Classic, BT LAP=Undiscoverable Bluetooth, BT LE= Bluetooth Low Energy, BT LE Random= Bluetooth Low Energy Private, WI FI=Wi-Fi and WI FI LAA=Wi-Fi Locally Administered Address.
The different colours represent the type of data source. The blue data at the bottom of the chart indicates the number of Bluetooth Classic probes detected, illustrating the amount of data collected by traditional “Bluetooth systems”.
We can see just how much additional data (everything above the blue) can be collected using state-of-the-art multi-scanning hardware compared with these traditional systems.
Let’s take a closer look at the three types of Bluetooth data – BT, BT LE, and BT LAP – and how they can be combined to maximise probe data collection.
Three types of Bluetooth data for probe data collection
1. Bluetooth Classic (BT)
This source captures devices such as hands-free kits, car stereos and GPS devices that are in discovery mode. Bluetooth Classic (BT) will not detect smartphones, even with Bluetooth turned on, as they are rarely in discovery mode, making them invisible to Bluetooth scanners.
Smartphones are only in discovery mode when you are on the Bluetooth settings page trying to pair to another device. Once two Bluetooth devices have gone through the pairing process (e.g., car stereo and phone), they can discover each other without needing discovery mode.
This is why Bluetooth scanning only gets about 10-15% of the total traffic and not 50% or more, and why Bluetooth scanners are not effective in pedestrian-only environments; the primary device you are trying to track is a smartphone – and the scanners can’t see them.
However, not being able to detect smartphones does sometimes work in its favour. In a mixed environment, your traffic data will get far less noise from pedestrians, cyclists, and buses full of people with smartphones.
Probes using BT MAC Addresses do not change identifier, making them perfect for trip analysis. If a probe can be detected by Bluetooth scanners, this suggests they operate constantly in discovery mode and can be reliably reidentified as they travel through the network.
2. Bluetooth Low Energy (BT LE)
Bluetooth Low Energy (BT LE) scanning can detect about 10 times more data than Bluetooth Classic scanning, but its use as a data source is more restrictive. BT LE can detect smart watches, fitness trackers, wireless headphones, plus many other Bluetooth smart and smart ready devices.
As many of these devices can be carried or worn by a person, the quantity of data captured more closely aligns with the number of people, not vehicles, moving around. This can make it problematic when trying to monitor vehicle travel times in locations with high pedestrian/cyclist activity.
Most BT LE data collected (about 90%) is capturing what is referred to as private MAC Addresses. As they are software generated, these MAC Addresses change over time (typically every 15-minutes or less), and within Addinsight we differentiate them from public BLE MAC Addresses as “BT LE Random”. This limits the usefulness of BT LE Random data to travel time and proximity reporting only.
Low-volume roads can greatly benefit from the additional travel time samples BT LE Random data produces, but the pairing rate reduces significantly as the distance between sensors approaches 15-minutes. This is because the probe will likely change MAC Address before it can be reidentified at the next downstream sensor.
On urban corridors, the increased sample rate can make traffic platoons visible. Below is an example of a road with a reversible segment in operation.
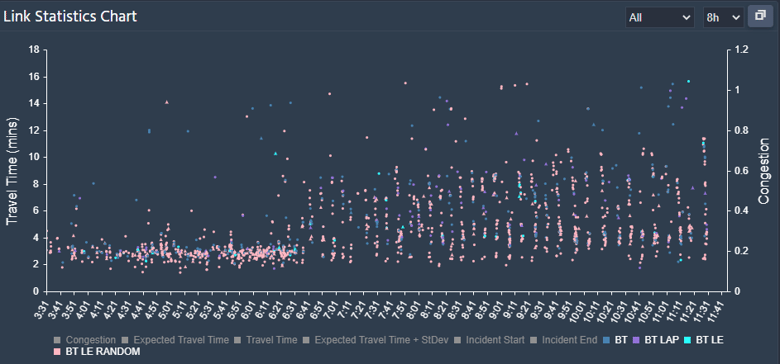
Link Statistics Chart per five-minute interval across a 4-hour window.
BT=Bluetooth Classic, BT LAP=Undiscoverable Bluetooth, BT LE= Bluetooth Low Energy, BT LE Random= Bluetooth Low Energy Private
Stoppages are clearly identifiable by the vertical columns of data points, and you can even see that the first vehicle in each platoon experienced the greatest travel time of about 10 minutes, while the last vehicle passed through undelayed in three minutes.
Unfortunately, BT LE Random is not useful for trip analysis. In the visualised map (pictured below), results show how southbound motorway traffic disperses across the road network based on Bluetooth Classic data only.
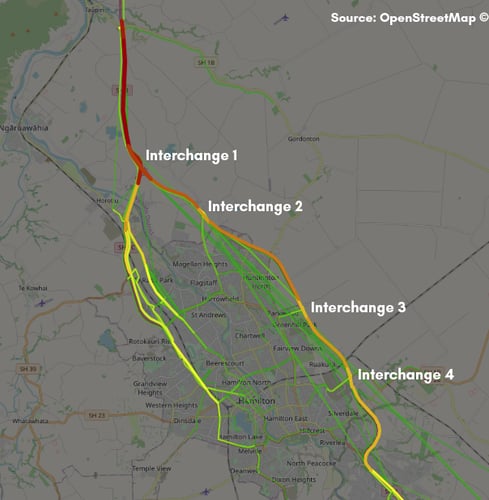
The table below compares the Bluetooth Classic results against BT LE and BT LE Random trips. Although BT LE Random has a much higher initial trip count, the proportion of these trips detected downstream diminishes rapidly due to the devices changing their MAC Address. This highlights the importance of understanding the data source and its limitations.
| Proportion of initial trips remaining after each motorway interchange |
|||
| Interchange |
Bluetooth (2800 trips) |
BT LE (700 trips) |
BT LE Random (7,100 trips) |
| 1 |
49% |
49% |
47% |
| 2 |
35% |
37% |
13% |
| 3 |
33% |
32% |
7.5% |
| 4 |
26% |
27% |
3% |
3. Undiscoverable Bluetooth (BT LAP)
When two Bluetooth Classic devices are paired together, they can both be discovered by specialised Undiscoverable Bluetooth (BT LAP) scanners – for example, a smartphone paired to a vehicle’s entertainment unit or hands-free kit.
Typically, the BT LAP sensors generate at least three times more samples than Bluetooth Classic, or about 30% of a road’s volume. As they rely on devices being paired, the samples may include two devices from the same vehicle.
Unlike all the other wireless sensor sources, BT LAP only captures half of the 12-character MAC Address, which is where the name comes from – Lower Address Part (LAP). This makes it a better method of data collection if privacy is a concern as the full identifier is never captured.
BT LAP data shares many of the same positive attributes of Bluetooth Classic data and tends to be associated with in-vehicle devices and the identifiers do not change, making it another great source of vehicle trip data. It’s also useful for increasing the number of travel time samples on low-volume and rural roads, particularly if you want to space the sensors more than 15-minutes apart.
From my experience in observing differences in probe data collection between intersection and motorway installations, BT LAP detection is less reliable than Bluetooth Classic as it appears to require a better signal strength and longer time in range for probes to be detected.
To ensure reliability within Addinsight, we’ve included functionality to create interpolated data points for these missed detections once the probe is detected further downstream.
What about Wi-Fi?
When I wrote the last blog post five years ago, there was a genuine debate between Bluetooth and Wi-Fi within the transport industry. At the time, Wi-Fi devices were starting to use software generated MAC Addresses, which has since become commonplace.
Not only has Bluetooth made significant strides, but Wi-Fi data continues to cause headaches from a quantity versus quality perspective. At an individual site level, Wi-Fi appears to generate a lot of data, however very few probes are reidentified at adjacent sites. This means very few trips or travel time samples are generated, despite hundreds of probes being detected at each site.
The amount of data collected at a site also doesn’t seem to correlate with the number of surrounding vehicles or people. We typically advise customers to turn off Wi-Fi scanning as the overhead of collecting and storing the data is not justified.
Comprehensive probe data at your fingertips
Ingesting data from a diverse range of field devices and sources, Addinsight is leading the way in probe data capture and management. The latest generation of probe scanners achieves exceptionally high pairing rates, allowing Addinsight to be highly responsive to changes in conditions.
If you’d like to understand more about the data that can be collected via Bluetooth devices, and how it can be used in transport planning, get in touch to arrange a live demonstration.
About the author: James Cox
James Cox is the Product Manager of Addinsight, playing an integral part in the development of the software since the very beginning. Previously developing the Addinsight platform at the Department of Infrastructure and Transport (DIT), James continued to support the development of the software as a member of the Addinsight team following its acquisition by SAGE Group in 2021.
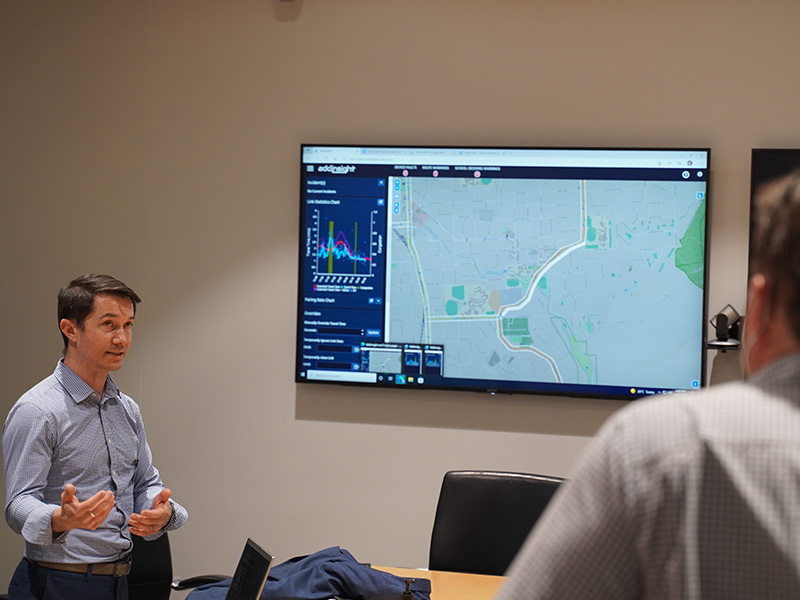
James Cox demonstrates the Addinsight platform to tour groups during an ITS event in 2022.
Working in traffic and transport related roles for more than 15 years and a specialist in software traffic analysis, James is as passionate as ever about supporting the growth of the Addinsight platform, used by every road authority across Australia and throughout a number of locations in New Zealand, with growing international interest.
